Abstract
Recent work on fairness-aware graph collaborative filtering (GCF) has shown the effectiveness of graph augmentation as a post-processing strategy for mitigating consumer unfairness. However, most studies remain confined to binary fairness setups and operate under limited experimental conditions, often relying on sparse and small-scale datasets. In this paper, we extend our fairness-aware augmentation method to address intersectional unfairness across demographic subgroups, a setting where the intersection of multiple sensitive attributes leads to fine-grained subgroups. To this end, we reformulate the fairness objective to incorporate intersectional demographic groups and evaluate our extended method across interaction configurations that vary in density and scale. Our results reveal that the effectiveness of fair graph augmentations is model-dependent and sensitive to dataset properties. We show that the edges selected during augmentation tend to concentrate around interpretable structural patterns driven by the connected nodes’ characteristics. Furthermore, analyzing how these augmented edges differ across graph-level attributes offers actionable insights into the potential benefits of fairness-oriented graph modifications. Finally, we compare our method with recent fairness-aware baselines, explore the impact of augmenting different graph regions, and assess our mitigation strategy under scenarios with minimal unfairness.
Motivation
Graph collaborative filtering (GCF) powered by graph neural networks (GNNs) has become a leading paradigm for personalized recommendation. As these systems shape access to information and opportunities, ensuring they treat all user groups equitably is increasingly important. Prior work on fairness-aware GCF, however, suffers from three compounding limitations:
- Binary fairness setups: Most studies define consumer groups along a single binary attribute (e.g., Male vs. Female), ignoring how multiple attributes interact to produce compounded disadvantages.
- Intersectionality gap: The intersection of multiple sensitive attributes (e.g., Gender × Age) creates fine-grained subgroups — Older Females, Younger Males, etc. — whose distinct fairness needs are invisible to binary formulations.
- Small-scale evaluation: Experiments are typically conducted on sparse, small datasets, leaving open whether findings generalise to denser, large-scale interaction graphs.
Goal: Extend fairness-aware graph augmentation to the intersectional setting and rigorously evaluate it across five datasets spanning a wide range of densities and scales, from 1.90% to 35.01% interaction density.
Method: Intersectionally Fair Graph Augmentation
We reformulate the fairness objective of graph augmentation to operate over intersectional demographic groups formed by combining two or more sensitive attributes. The core concepts are:
- IDPR (Intersectional Demographic Parity in Recommendation): A fairness criterion requiring that recommendation utility (NDCG) be equal across all intersectional subgroups simultaneously, rather than just between two groups.
- ε-IDPR: A practical relaxation of the strict IDPR constraint that allows a tolerance ε in the parity requirement, making the optimisation tractable while retaining meaningful fairness guarantees.
- Loss function: The augmentation is guided by a two-term objective — a fairness loss Lfair minimising the utility disparity Δ across intersectional subgroups, and a distance loss Ldist controlling how much the augmented graph departs from the original.
Sampling Policies
To make augmentation tractable, candidate edges are drawn from a restricted pool defined by sampling policies applied independently on the user and item side:
| Policy | Side | Description |
|---|---|---|
| ZN | User | Users with no relevant items in the top-k list (NDCG@k = 0) |
| FR | User | Users furthest from the advantaged group in graph distance |
| IR | User | Users selected by inter-group distance criteria |
| IP | Item | Items most preferred by the disadvantaged group |
| IT | Item | Items with high inter-group transferability |
| PR | Item | Items selected by popularity-relative criteria |
Experimental Setup
We evaluate across five datasets that collectively cover sparse, medium-density, and dense interaction graphs in the music, movie, and short-video domains, using two intersectional sensitive attribute pairs (Gender × Age and One-hot Feat0 × One-hot Feat13).
Datasets
| LFM1M | ML1M | KRECS | |
|---|---|---|---|
| # Users | 4,546 | 6,040 | 1,401 |
| # Items | 12,492 | 3,706 | 3,060 |
| # Interactions | 1,082,132 | 1,000,209 | 1,502,531 |
| Min. Degree per user | 20 | 20 | 229 |
| Density | 1.90% | 4.47% | 35.01% |
| Sensitive Attribute | Gender | Age | Gender | Age | One-hot Feat0 | One-hot Feat13 |
| Subgroup M|Y / 0|0 | 44.3% | 41.2% | 58.7% |
| Subgroup M|O / 1|0 | 34.2% | 30.5% | 31.8% |
| Subgroup F|Y / 0|1 | 16.5% | 15.5% | 5.2% |
| Subgroup F|O / 1|1 | 5.1% | 12.8% | 4.3% |
GCF Models
We evaluate five state-of-the-art graph collaborative filtering models: HMLET, LightGCN, NGCF, SGL, and XSimGCL.
RQ1: Intersectional Fairness
The first research question asks whether our fairness-aware augmentation effectively reduces utility disparity Δ across intersectional subgroups on the three base datasets (LFM1M, ML1M, KRECS).
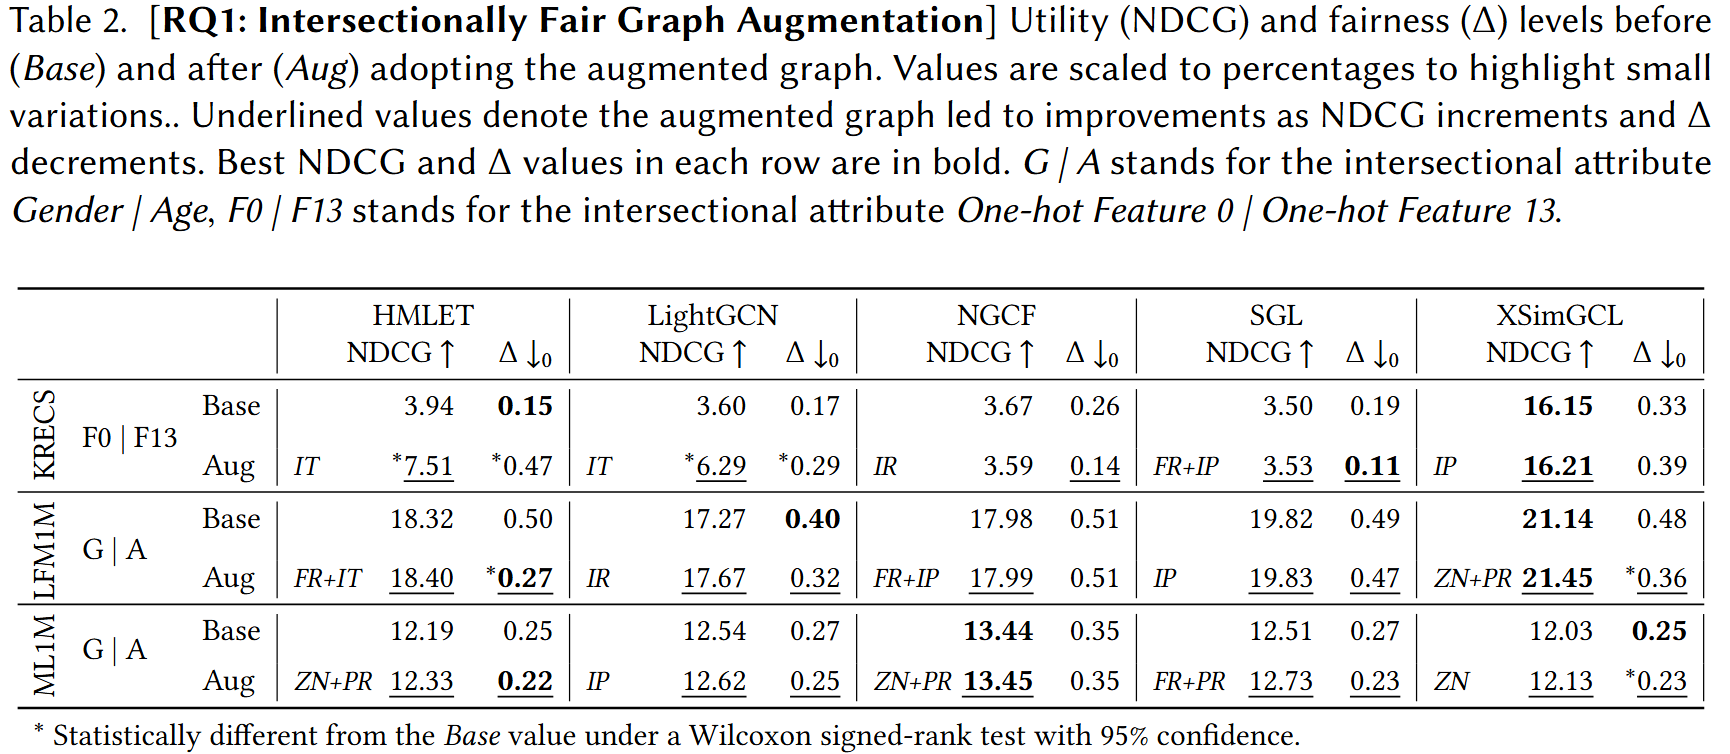
- Model-dependence: The effectiveness of fair graph augmentation varies substantially across GCF models — augmentation reliably reduces Δ on some architectures while having limited or no impact on others.
- Utility preservation: In settings where fairness improves, recommendation utility (NDCG) is largely preserved or increased, showing the augmentation does not trade off quality against fairness in the intersectional case.
- Dataset sensitivity: Results differ across LFM1M, ML1M, and KRECS, pointing to a strong interaction between dataset properties (density, scale) and mitigation effectiveness.
RQ2: Scale and Density
To isolate the effect of interaction density and dataset scale, we introduce two additional datasets derived from MovieLens 1M and KuaiRec with higher k-core thresholds, producing denser interaction graphs.
| ML1MD | KRECB | |
|---|---|---|
| # Users | 2,595 | 7,101 |
| # Items | 1,829 | 8,720 |
| # Interactions | 741,478 | 10,155,233 |
| K-core Threshold | 110 | — |
| Min. Degree per user | 110 | 79 |
| Density | 15.61% | 16.40% |
| Sensitive Attribute | Gender | Age | One-hot Feat0 | One-hot Feat13 |
| Subgroup M|Y / 0|0 | 46.7% | 55.4% |
| Subgroup M|O / 1|0 | 29.0% | 34.1% |
| Subgroup F|Y / 0|1 | 14.0% | 5.5% |
| Subgroup F|O / 1|1 | 10.3% | 4.9% |
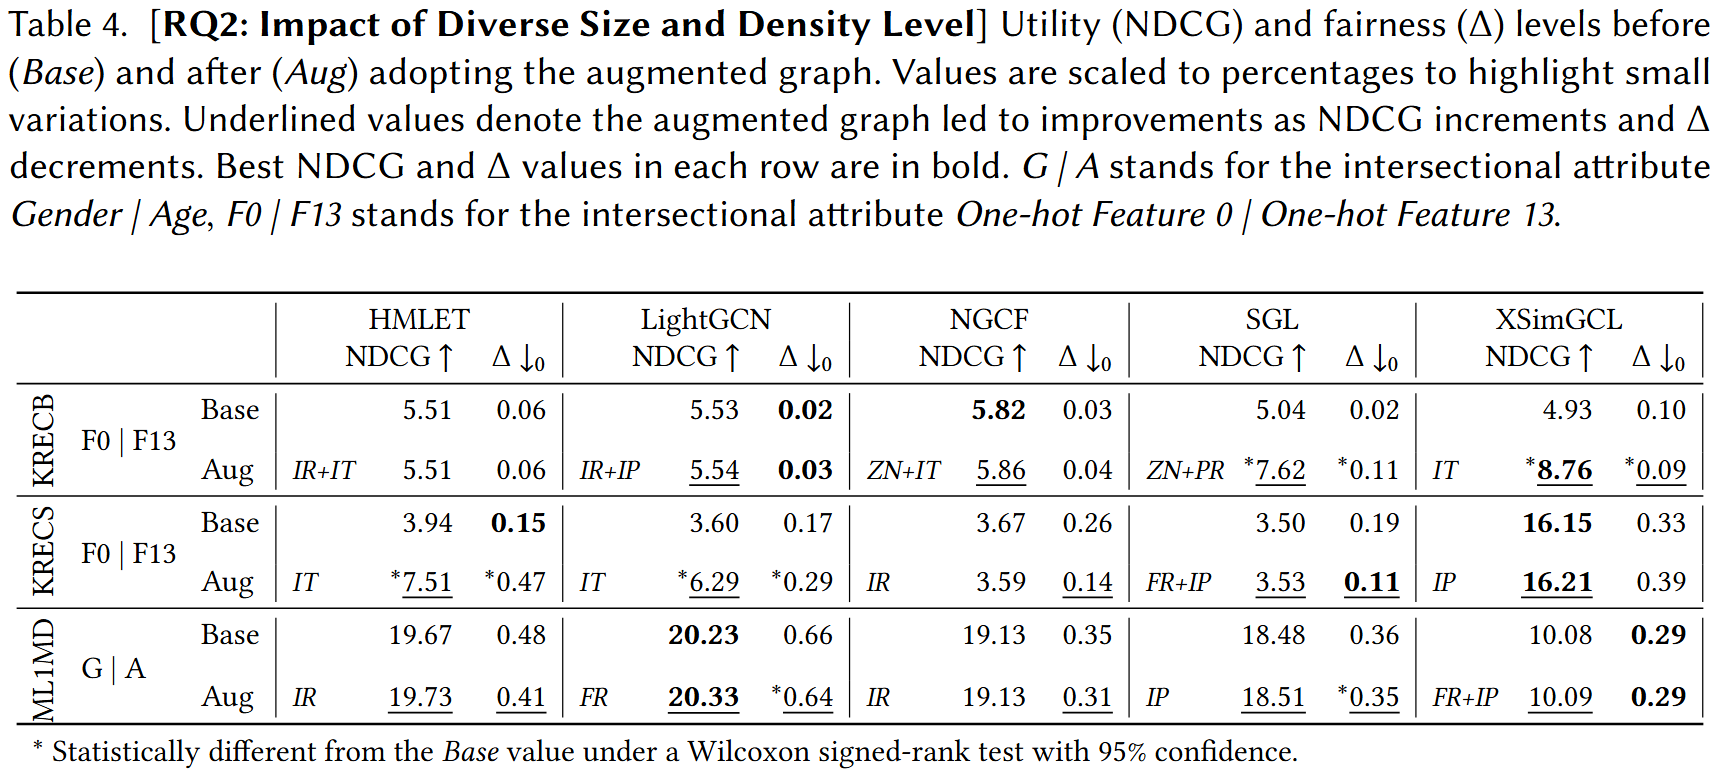
- Density amplifies model-dependence: The pattern of which models benefit from augmentation shifts when density increases, confirming that dataset properties interact non-trivially with the augmentation mechanism.
- Large-scale feasibility: Our method successfully operates on KRECB with over 10 million interactions, demonstrating scalability beyond the small-scale datasets used in prior work.
RQ3: Augmentation Interpretability
We analyse the structural characteristics of the edges added during augmentation using three graph-level metrics: node degree (DEG), degree-type ratio (DTY), and inter-group distance (IGD). Edges are grouped into quartiles Q1–Q4 per metric and per intersectional subgroup.
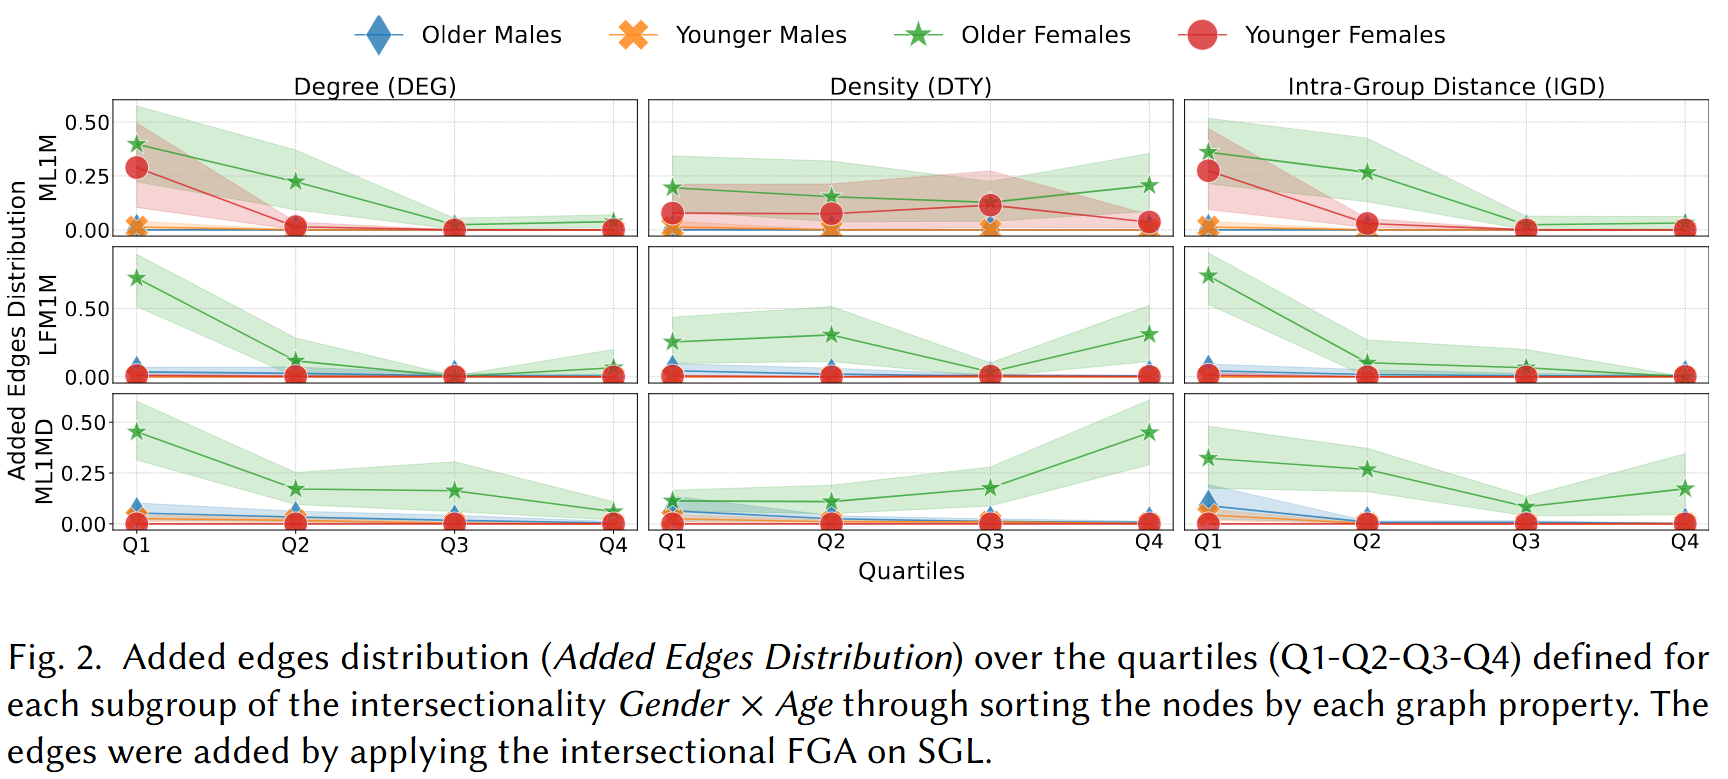
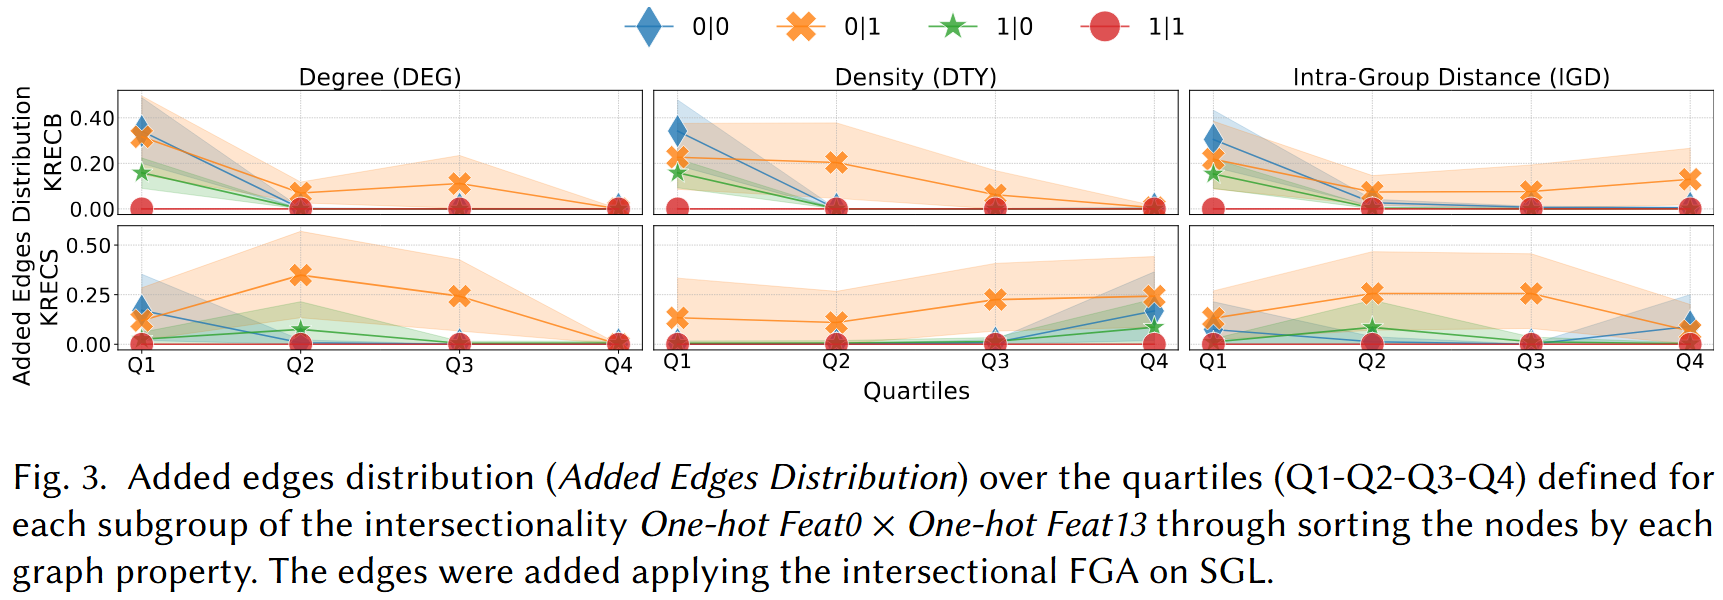
- Structural concentration: Augmented edges do not distribute uniformly — they concentrate in interpretable structural regions of the graph, driven by the degree and type characteristics of the connected nodes.
- Subgroup-specific patterns: Different intersectional subgroups receive edges in different graph regions, revealing that the augmentation implicitly adapts to each group's structural position.
- Consistent across dataset types: The DEG/DTY/IGD patterns are broadly consistent between Gender×Age datasets and One-hot attribute datasets, suggesting the interpretability findings generalise across attribute types.
RQ4: Distributional Shift
We investigate whether the gap between validation-set and test-set fairness gains can be predicted from the distributional shift between the two splits, measured via energy distance.
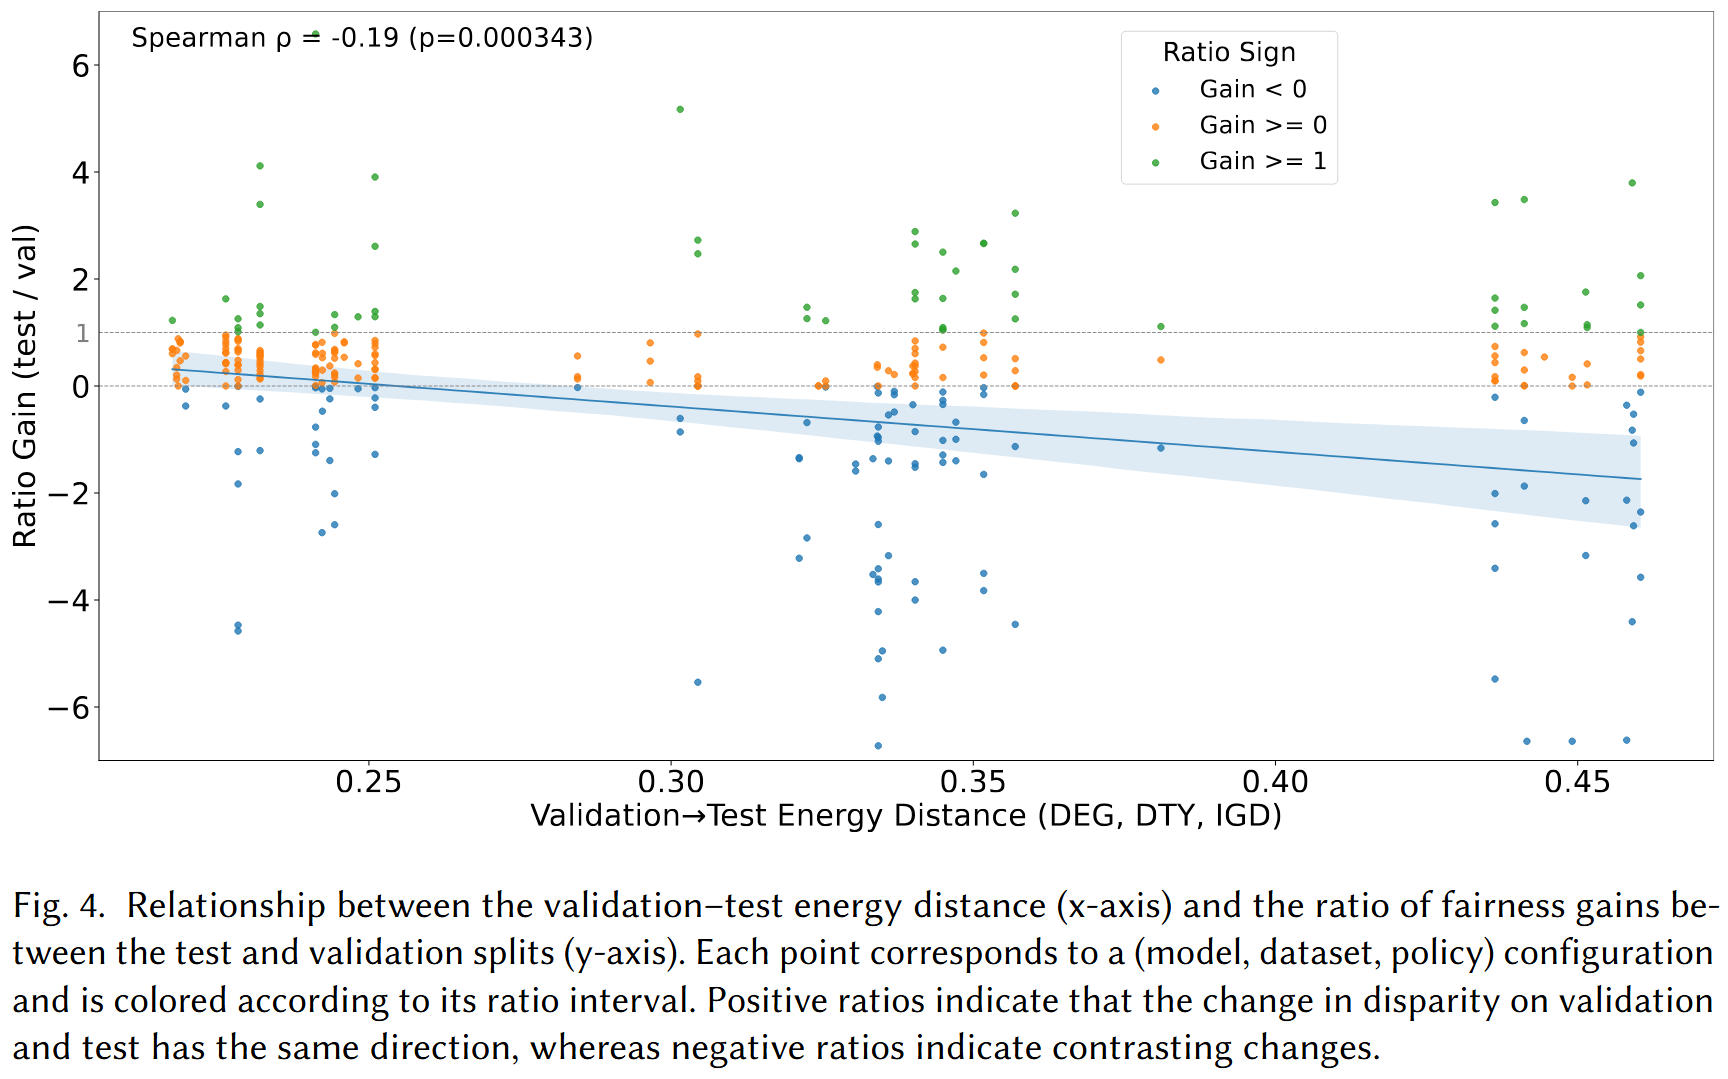
Finding: A statistically significant negative correlation (Spearman ρ = −0.19, p = 0.000343) is observed between the validation–test energy distance and the ratio of fairness gains. Larger distributional shifts between validation and test sets are associated with weaker generalisation of fairness improvements from validation to test, providing a practical signal for anticipating mitigation reliability.
Additional Analyses
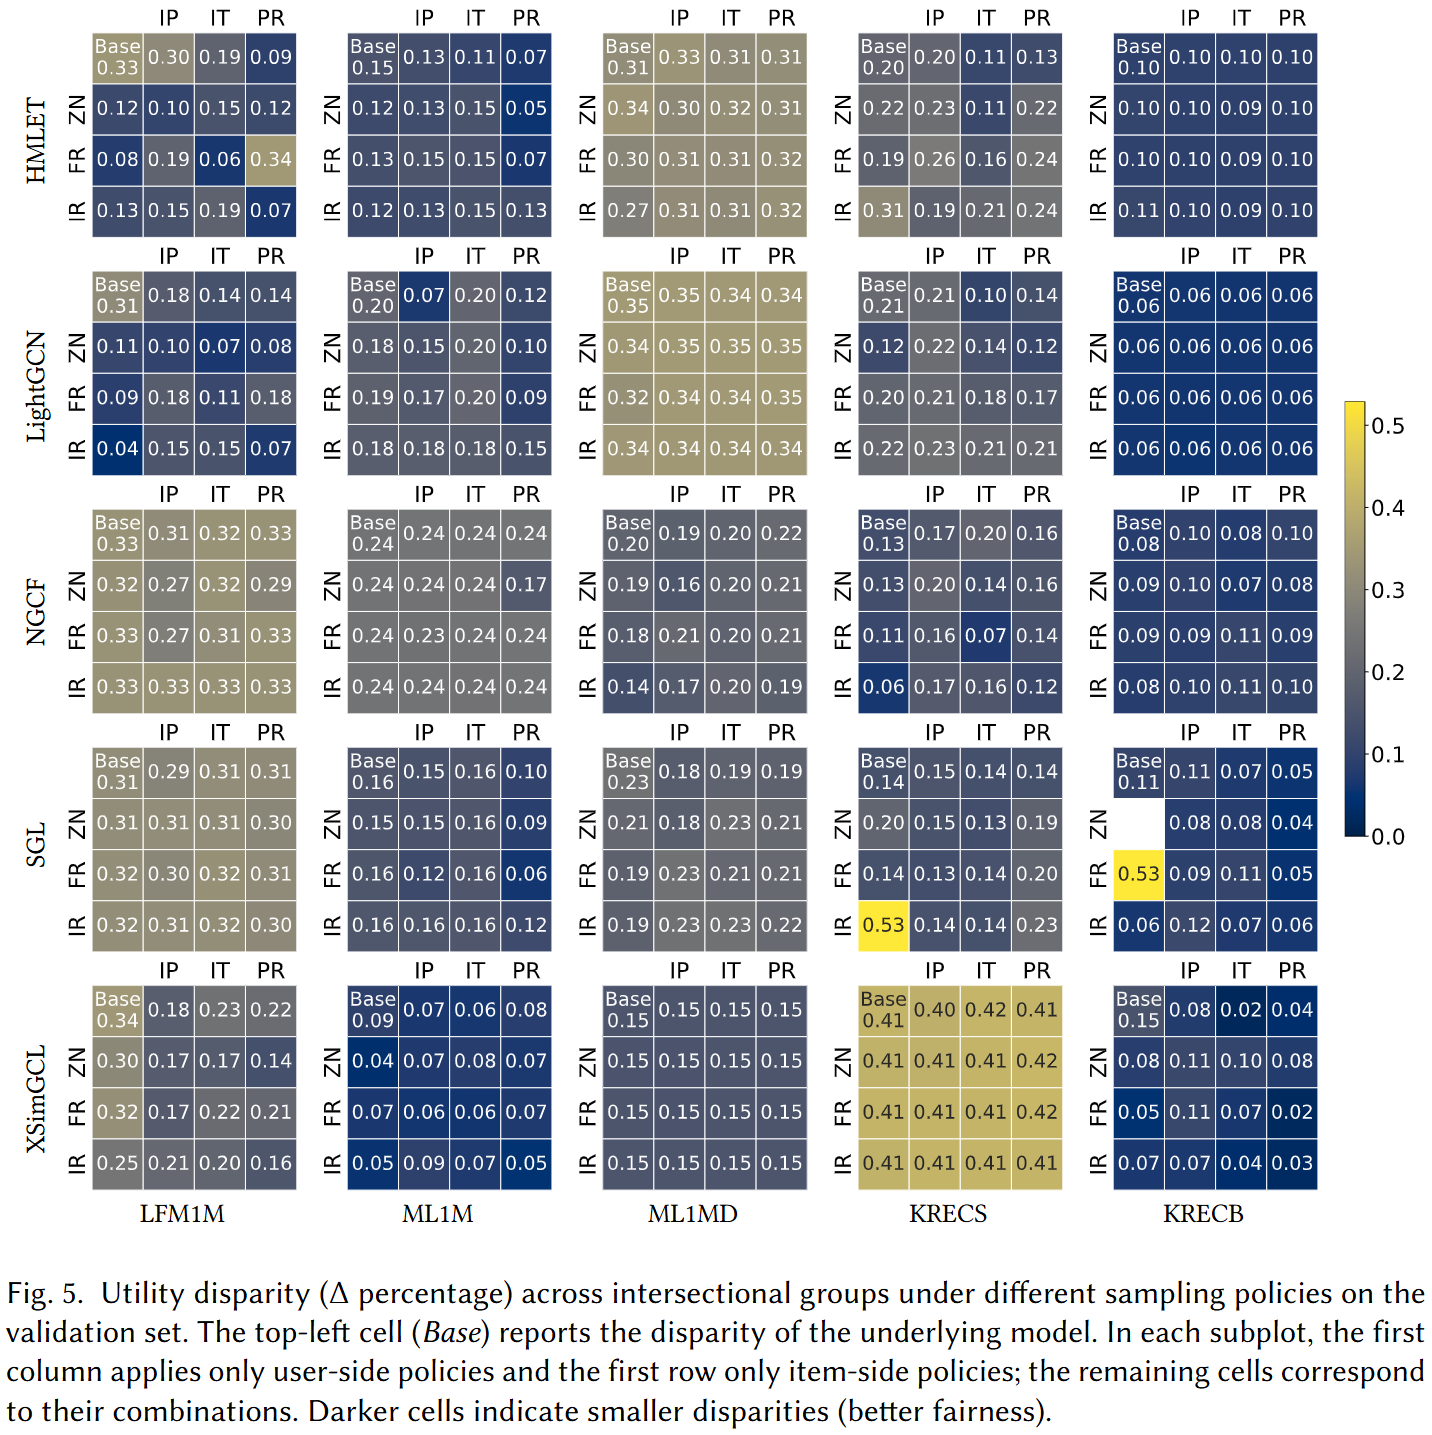
Sampling Policy Ablation
We ablate all 15 combinations of user-side and item-side sampling policies across five GCF models and five datasets to identify which policy combinations are most consistently effective.
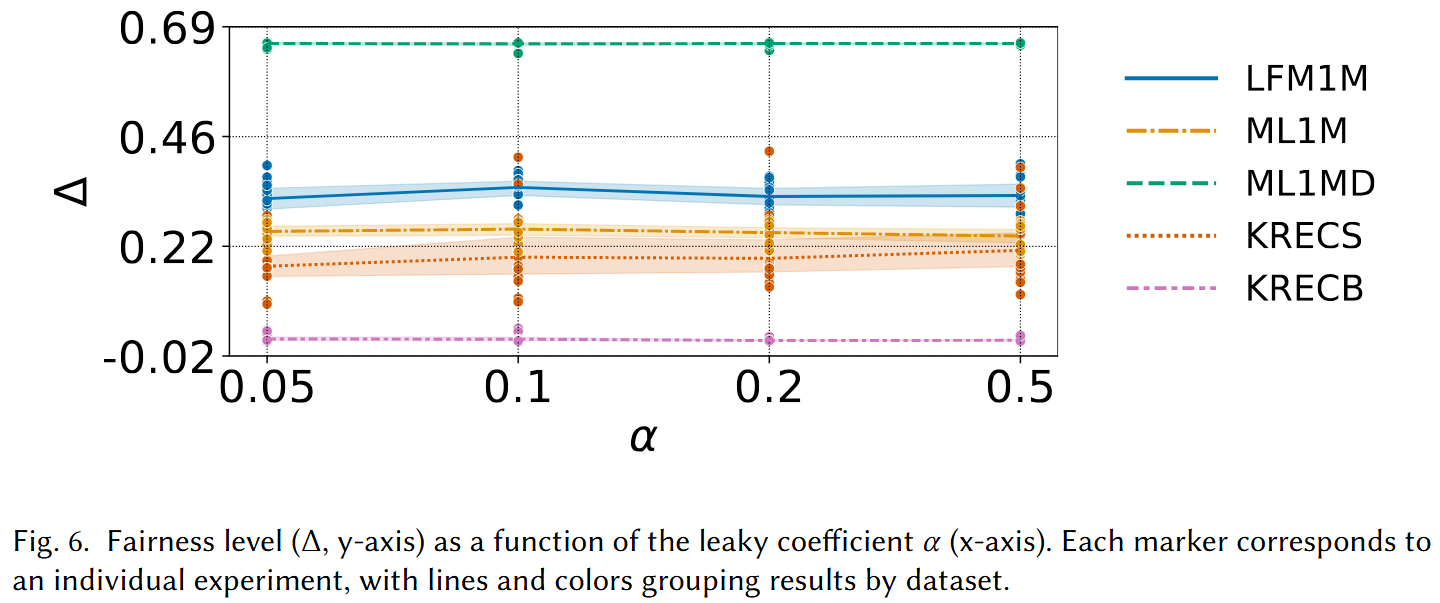
Leaky Coefficient Ablation
We study how the leaky coefficient α — which controls the sharpness of the augmentation objective — affects the resulting fairness level Δ across all five datasets.
Comparison with ITFR
We compare our method against the ITFR fairness-aware baseline on LightGCN across all five datasets. Bold values indicate the best result per metric per dataset; asterisked (*) values signal low absolute utility.
| LFM1M NDCG↑ | LFM1M Δ↓ | ML1M NDCG↑ | ML1M Δ↓ | ML1MD NDCG↑ | ML1MD Δ↓ | KRECS NDCG↑ | KRECS Δ↓ | KRECB NDCG↑ | KRECB Δ↓ | |
|---|---|---|---|---|---|---|---|---|---|---|
| ITFR | 16.49 | 0.56 | 11.85 | 0.28 | 16.64 | 0.42 | *4.29 | 0.19 | *6.16 | 0.10 |
| Ours | 17.67 | 0.32 | 12.62 | 0.25 | 20.33 | 0.64 | *6.29 | 0.29 | *5.54 | 0.03 |
Our method achieves superior utility on four of five datasets and the best fairness on three of five, while ITFR wins on fairness for ML1MD and KRECS. No single method dominates across all configurations, highlighting the importance of dataset-aware method selection.
Key Contributions
- Intersectional Fairness Formulation: First extension of fairness-aware graph augmentation beyond binary setups, introducing the IDPR criterion and its ε-IDPR relaxation for intersectional demographic groups.
- Large-scale Evaluation: Comprehensive experiments across five datasets spanning densities from 1.90% to 35.01% and up to 10 million interactions, demonstrating scalability and dataset sensitivity of the method.
- Interpretable Augmentation Patterns: Structural analysis via DEG, DTY, and IGD metrics reveals that augmented edges concentrate in interpretable graph regions, offering actionable insights into fairness-oriented graph modifications.
- Distributional Shift Indicator: Evidence that energy distance between validation and test distributions predicts generalisation of fairness gains (Spearman ρ = −0.19), providing a practical diagnostic signal.
- Ablation and Baseline Comparison: Thorough ablation of 15 sampling policy combinations and comparison with ITFR, clarifying conditions under which each approach is preferable.
BibTeX
@article{boratto2026intersectional,
  author = {Boratto, Ludovico and Fabbri, Francesco and Fenu, Gianni and Marras, Mirko and Medda, Giacomo},
  title = {Graph Augmentation for Intersectional Unfairness Mitigation: A Study across Dataset Scales and Interaction Densities},
  journal = {ACM Transactions on Recommender Systems},
  year = {2026},
  doi = {10.1145/3798097},
  url = {https://doi.org/10.1145/3798097}
}